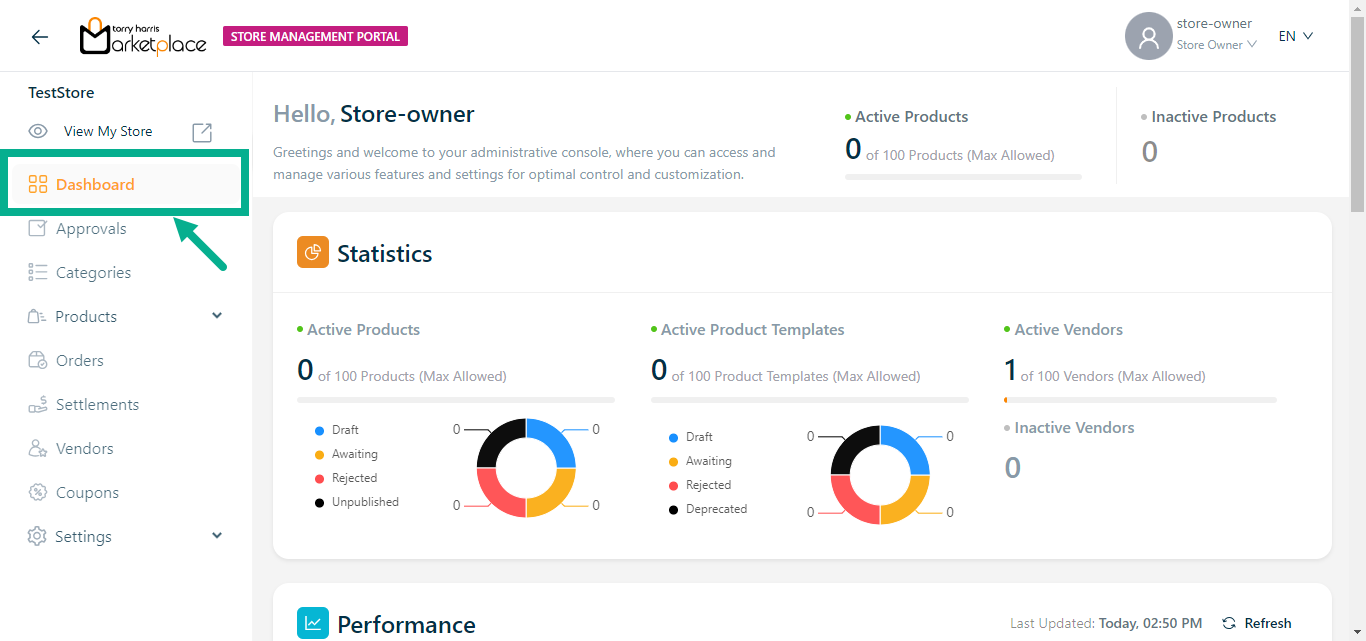
Dashboard
Dashboard are collections of several data kinds that are linked to one another and condensed for ease of comprehension. Dashboards, a popular type of data visualization, usually include graphs, charts, and tables as their main visual elements.
- Statistics - Statistics allows us to make sense of data by identifying patterns and generating conclusions.
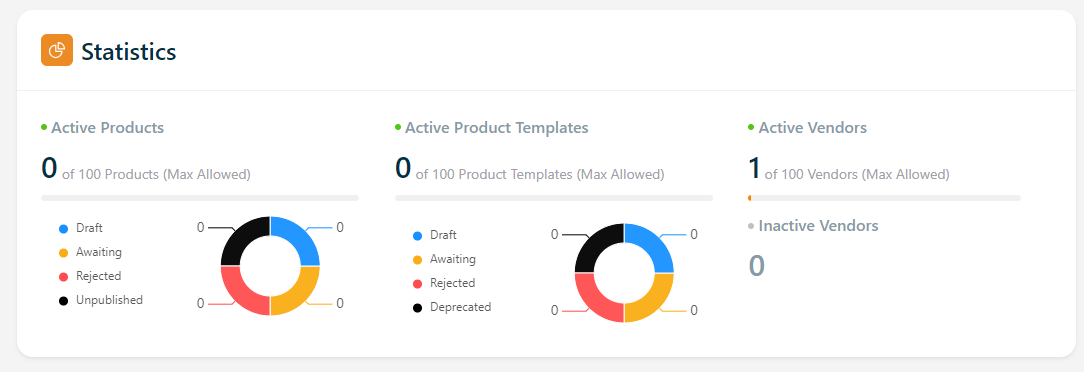
- The Active Products section displays the maximum number of products that can be published as well as the number of products that have already been published.
info
The number of products in Draft, Awaiting, Rejected, and Unpublished statuses is also shown in graphical form.
- The Active Product Templates section displays the maximum number of product templates that can be published as well as the number of product templates that have already been published.
info
The number of product templates in Draft, Awaiting, Rejected, and Deprecated statuses is also shown in graphical form.
- The Active Vendors section displays the maximum number of vendors that can be activated as well as the number of vendors have already been activated.
info
It also shows the number of inactive vendors.
- Performance - Performance is a measure of effectiveness or efficiency in accomplishing desired results.
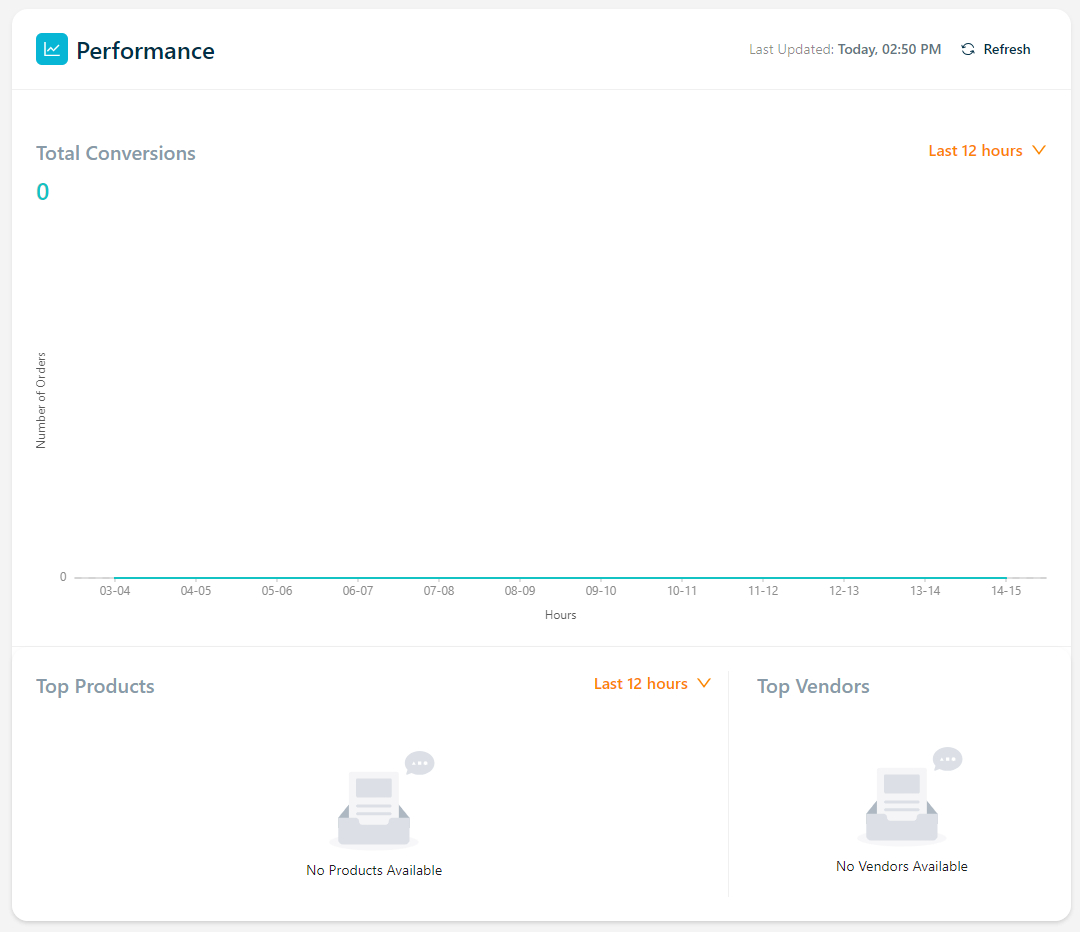
- The Total Conversions section shows the total number of orders placed within a specific time period in graphical form.
info
The feasible time periods include:
- Last 12 hours
- Last 7 days
- Last 4 weeks
- Last 12 months
- The Top Products section displays the top 5 products placed within a specific time period.
info
The feasible time periods include:
- Last 12 hours
- Last 7 days
- Last 4 weeks
- Last 12 months
- The Top Vendors section displays the names of the top 15 vendors only if any order is placed.
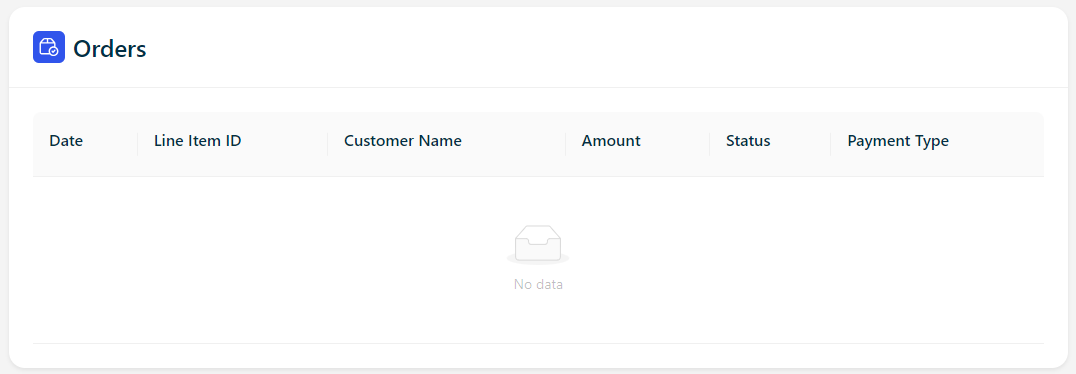
- Orders - The orders section displays the recent five orders with the Date, Line Item ID, Customer Name, Amount, Status and Payment Type.