Dashboard
Dashboard are collections of several data kinds that are linked to one another and condensed for ease of comprehension. Dashboards, a popular type of data visualization, usually include graphs, charts, and tables as their main visual elements.
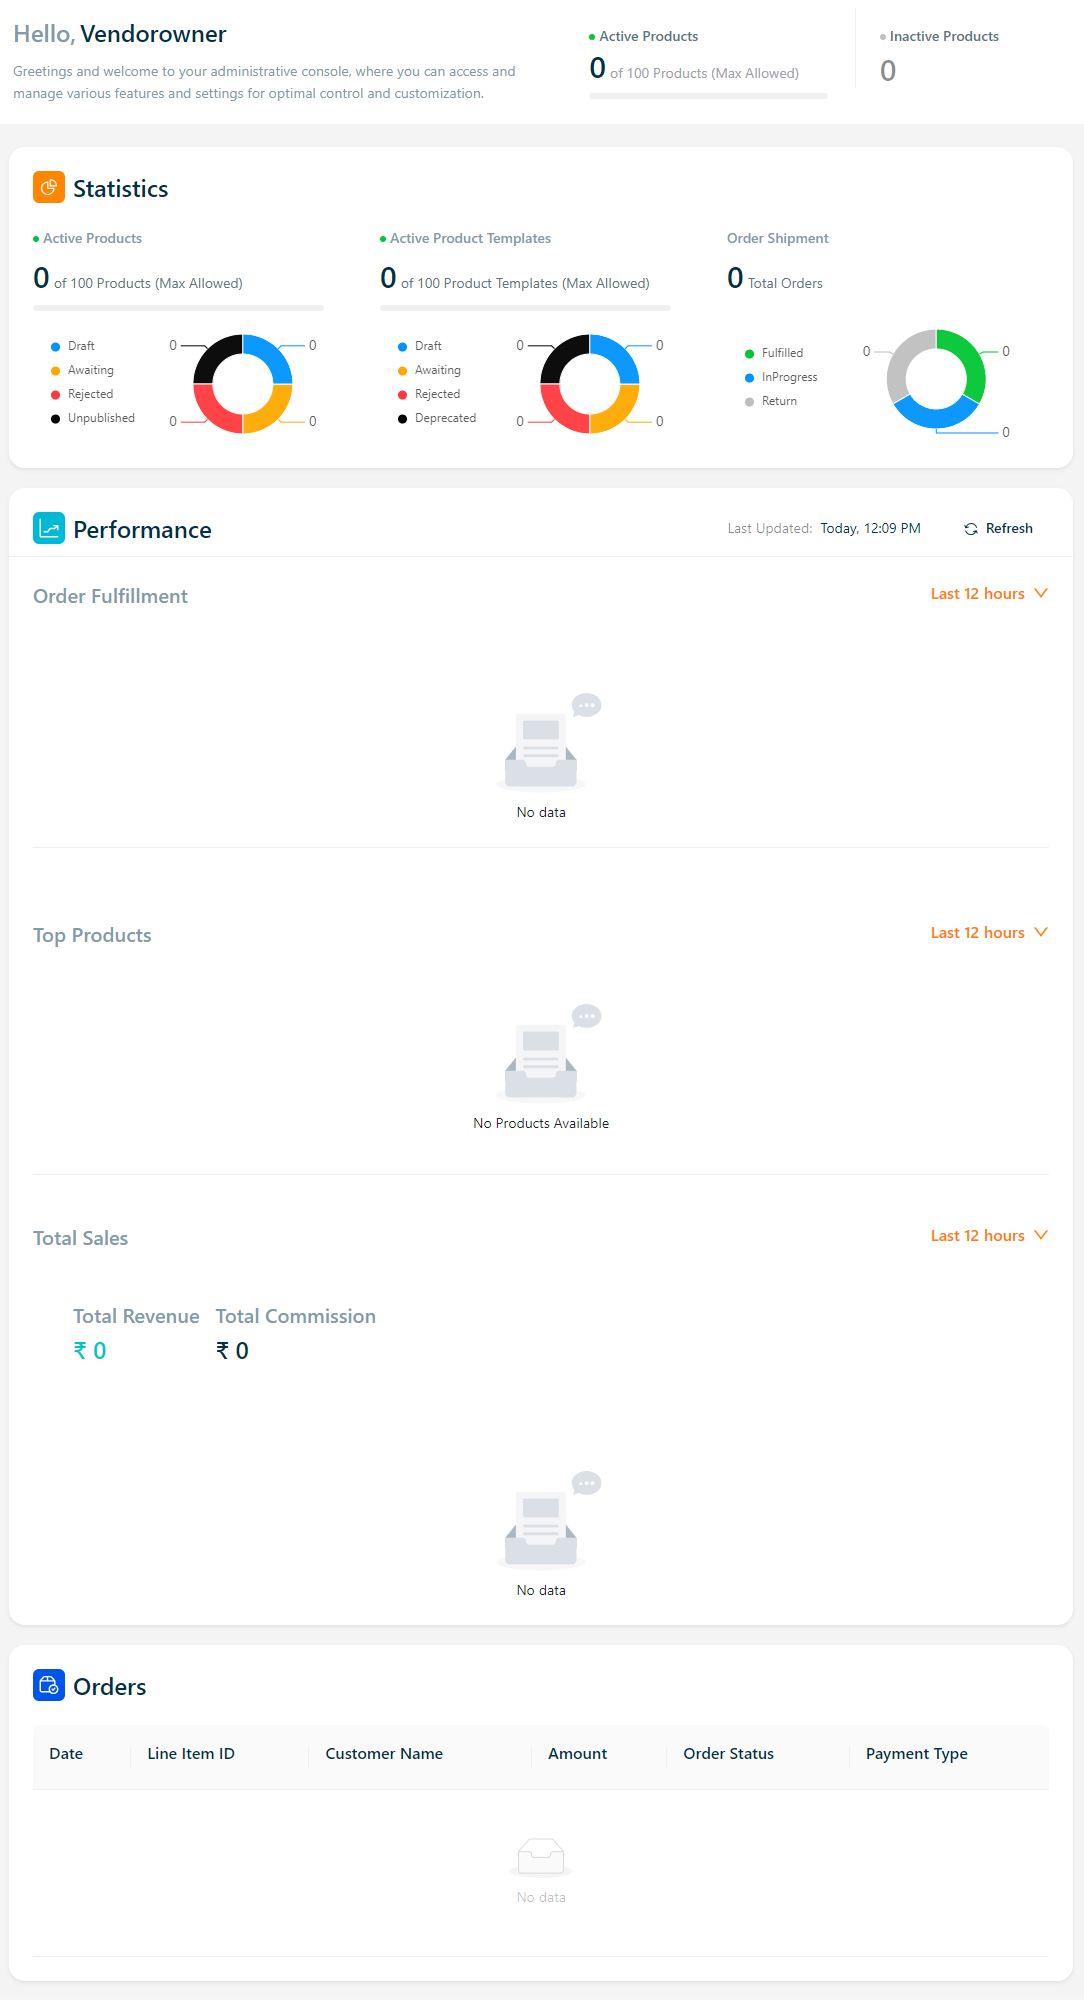
For example: As per the above screenshot, the maximum number of products that can be published is 100 and the number of products that have been published is 0.
Click the Refresh button to reload the information.
The Statistics section displays the number of active products, number of active product templates and number of order shipment
a. Number of Active Products - The maximum number of products that can be published is 100 and the number of products that have been published is 0.
infoTotal total number of Draft, Awaiting, Rejected and Unpublished products is displayed in graphical view.
b. Number of Active Product Templates - The maximum number of product templates that can be published is 100 and the number of product templates that have been published is 0.
infoTotal total number of Draft, Awaiting, Rejected and Deprecated product templates is displayed in graphical view.
c. Number of Order Shipment - The number of order shipment section displays the number of fulfilled orders.
infoTotal total number of Fulfilled, InProgress and Return orders is displayed in graphical view.
The Performance section displays the order fulfillment, top products and total sales for the active stores.
a. Order Fulfillment - The Order Fulfillment section displays the number of orders fulfilled and orders received per time period.
For example, if you select the last four weeks from the dropdown, a chart displays the number of orders fulfilled per weeks.
b. Top Products - The Top Products section displays the top 3 products per time period.
For example, if you select the last four weeks, a chart displays top 3 products per weeks.
c. Total Sales - The Total Sales section displays the number of Total Revenue and Total Commission per time period.
For example, if you select the last four weeks, a chart displays the number of Total Revenue and Total Commission per weeks.
The Orders section displays the recent five orders with the Date, Line Item ID, Customer Name, Amount, Order Status and Payment Type.